
Ecosystem-level EOVs
What the Workbench does
Marine plankton - from phytoplankton to zooplankton - sit at the base of the ocean food web, and tracking their diversity, distribution and biomass across the globe is essential to understanding ocean health. But observations of plankton come from very different methods: microscope counts, quantitative imaging systems, and genomic sequencing (metagenomics) of seawater samples. Historically these data types have been hard to compare or combine, leaving a real gap in globally consistent biological ocean variables.
The Ecosystem Workbench closes this gap. It draws together large collections of plankton observations from EMODnet/EurOBIS and ELIXIR, as well as international repositories such as AtlantECO, OBIS, GBIF and Ocean Microbiomics (which in turn integrate outputs from EcoTaxa and ELIXIR's MGnify), and feeds them into a single standardised modelling pipeline.
The engine: CEPHALOPOD
At the heart of the workbench is CEPHALOPOD, a fully documented, automated modelling framework built to handle sparse, biased and heterogeneous biological data. It can ingest four distinct data types (species occurrences, abundance counts, biomass measurements, and metagenomic reads) and, through a consistent sequence of pre-processing, statistical modelling and quality-control steps, turn them into continuous, comparable maps of where plankton live and how abundant they are — even though the underlying observations were collected in completely different ways.
Because every dataset goes through the same quality checks, results generated from a microscope count and results generated from a genomic sample become directly comparable for the first time at a global scale. The pipeline is scalable enough to model many species at once and generates a plain-language PDF report for every run, so that non-specialists can judge how reliable a given map is.
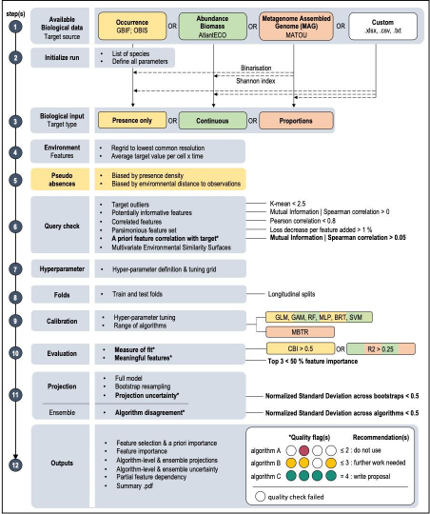
The CEPHALOPOD modelling pipeline: from raw biological data (top) through quality checks and modelling steps to final EOV/EBV outputs (bottom)
What it delivers
The workbench produces monthly global maps (at 1° x 1° resolution) of plankton species diversity and distribution in the epipelagic layer, and estimates of plankton biomass across 10 functional groups in the epipelagic zone (0–200m) and 8 in the mesopelagic zone (200–500m). All outputs can be explored interactively through the CEPHALOview application, and the pipeline itself is openly available for reuse or extension to new species and data types.
Learn more about its workflows, tools and user documentation
This task is led by Meike Vogt and Matthias Muennich, ETH Zurich. Watch Meike and Matthias's Interview about this workbench.